|
|
Applied Geophysics : Seismics |
Applet ( in sepatate window, ca. 640 x 460 Pixel )
The applet simulates a field test of a short period seismometer, to determine
- the natural frequency and damping,
- the two parameters, characterizing a seismometer's tranfer function,
- the "critical damping resistance" and the open circuit damping,
- allowing to adjust a desired damping value,
- and
- the sensitivity ( motor constant ) of the velocity transducer and the motor constant of the calibration coil.
( See Seismometer Documentation for physical / mathematical background )
Seismometer :
- The applet refers to a Geotech Model S-13, configured for vertical operation, equipped with a velocity transducer
- with four separate coils ( about 380 [Ohm] / 100 [Vs/m] each )
- and
- one calibration coil ( about 23 [Ohm] / 0.2 [N/A] ).
- Two windings connected in series are used as a signal coil,
- driving a high impedance recording device,
- the remaining two windings are used for damping only,
- to provide a constant sensitivity of the velocity output,
- independent of the actual load resistance of the damping circuit.
Colorcode :
Blue = mechanical system, moving parts, mass displacement,
( "true" seismometer parameters in CALC DISPLAY ),Magenta = coil assembly,
( Amplitude picks in PICK DISPLAY, calibration results in CALC DISPLAY ),Red = signal coil circuit, output signal
( = mass velocity ),Yellow = damping coil circuit, external damping resitance adjustment, symbolic damping assembly
( piston + cylinder, oil / honey filled, select your own preferred interpretaion ),Green = calibration coil circuit, calibration signal ( current / weight ), current adjustment ( frequency and magnitude ).
The actual state of the instrument ( velocity and excursion of the movable mass ) is calculated in constant time steps of 20 [ms] ( = 50 steps/second ) by a recursive filter, applied to the driving signals ( calibration signals, seim. noise ).
- Index -
- Program Control
- Calibration Procedures
- Natural Frequency
- Free Motion
- Interpretation
- Related Applets
- Download
Dialogue Panel :
( Screenshot )

The animation is controlled by the buttons RESET, RUN, HALT and STEP :
- RESET
- erases all data saved for parameter calculation,
- RUN / HALT
- starts / interrupts the simulation,
- STEP
- single step mode, one time increment ( 20 [ms] ) per click.
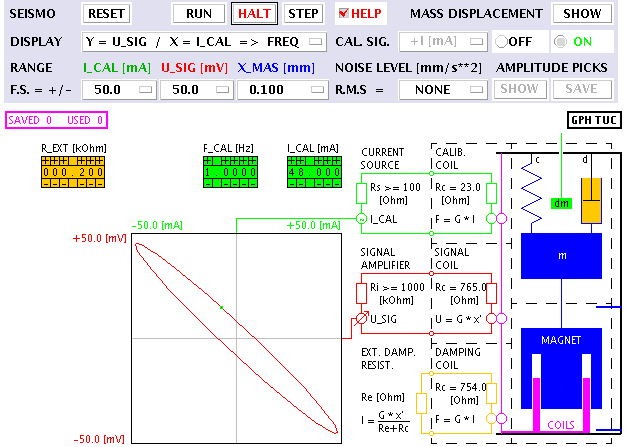
DISPLAY Y = ... / X ... selects one of three calibration procedures :
Y = U_SIG / X = I_CAL => FREQ
- The natural frequency of the seismometer is determined from the phase shift between
- a harmonic calibration current
- and
- the resulting harmonic output voltage,
- observed in a XY-display.
- ( see Natural Frequency and Band Pass B(s) in Seismometer Documentation )
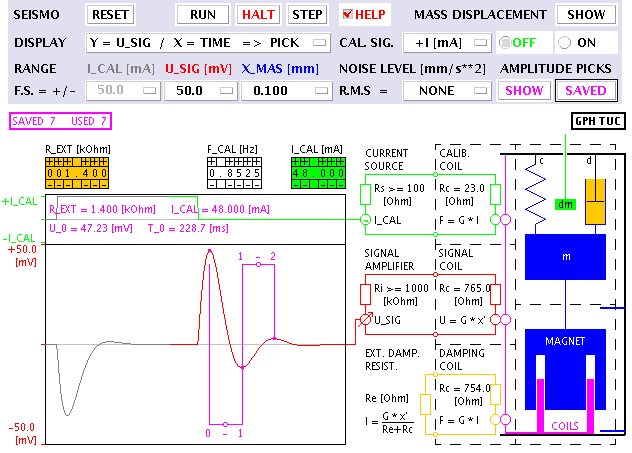
Y = U_SIG / X = TIME => PICK
- The damping of the seismometer for different values of the external damping resistance is determined
- from the free motion of the movable mass,
- resulting from
- switching on / off a dc-current in the calibration coil
- or
- dropping / lifting a small additional mass.
- ( see Damping and Free Motion of the Seismometer Documentation )
- The amplitude values of extrema of the output voltage are
- displayed for interpretation by the user,
- and can be
- saved for interpretation in the procedure CALC.
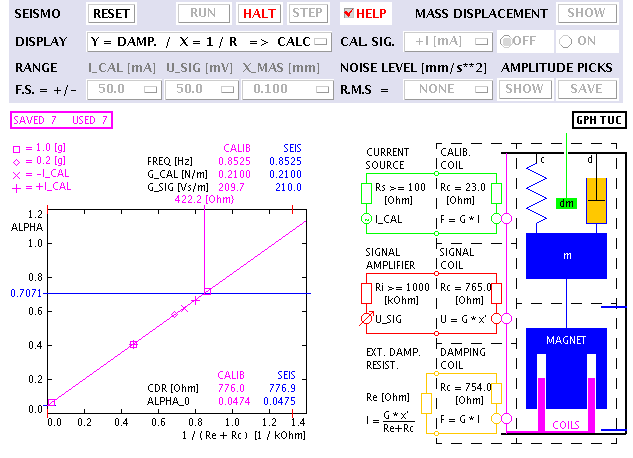
Y = DAMP / X = 1 / R => CALC
- The different values of damping are calculated from the amplitude picks saved and plotted
- versus the reciprocal of the total resistance in the damping circuit.
- A straight line is fitted to the observations
- to determine the open cicuit damping and the "critical damping resistance".
- If both, a weight lift test and a dc-current test are performed
- for the same damping resistance,
- the motor constants of the signal coil and of the calibration coil
- are determined from the peak-to-peak amplitudes of both output signals.
- ( see Damping and Free Motion of the Seismometer Documentation )
In the procedures FREQ and PICK, where the output signal is displayed,
- MASS DISPLACEMENT SHOW
- additionally displays the excursion of the mass ( blue ) from its zero-position,
- RANGE I_CAL [mA], U_SIG [mV] und X_MAX [mm] ( F.S. = +/- ... )
- determines the scaling of the graphic display in steps 1 - 2 - 5,
- and NOISE LEVEL [mm/s**2] ( R.M.S = ... ) selects
- the magnitude of local seismic noise :
- NONE
- ideal but not realistic,
- 5.0e-5
- corresponds to the ground acceleration at a quiet site and leads to reliable results,
- 5.0e-3
- !don't try to calibrate a seismometer at the third floor of a building !
Program Control Index Top of Page
- Calibration Procedures -
The natural frequency of the seismometer, the parameters necessary for the adjustment of the damping and the sensitiviies of signal and calibration coil are determined in three procedures.
Y = U_SIG / X = I_CAL => FREQ :
( Screenshot )

Natural Frequency Program Control Index Top of Page
Y = U_SIG / X = TIME => PICK :
( Screenshot )

- +I [mA] / -I [mA]
- dc-current of selectable polarity and adjustable amplitude ( I_CAL [mA], green ), controlled by ON / OFF,
- 1.0 [g] / 0.2 [g]
- additional mass, contolled by DROP / LIFT.
Free Motion Calibration Procedures Program Control Index Top of Page
Y = DAMP / X = 1 / R => CALC :
( Screenshot )

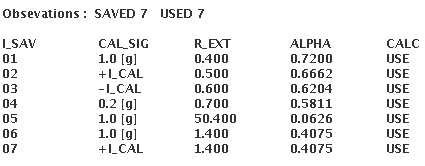
List of Observations :
( Screenshot )

( See Seismometer Documentation for physical / mathematical background )
Interpretation Calibration Procedures Program Control Index Top of Page
Frequency Response of a Seismometer
Free Motion of a Seismometer
Class and html files for a local installation of the seismometer applets ( DEMO + CALIB ) are available as a zip file and as a tar.gz file.
More applets at : Geophysics Department TU Clausthal
Rev. 06-apr-2007
Comments to
Fritz Keller
( ned gschempfd isch globd gnueg )